Short answer. Over the ten years to 30 October 2026, yes. The median scheme in every equity category beat an FD locked for ten years at the best rate major banks offered in October 2016, by 3.3 to 7.7 percentage points a year. Over five years the lead was thinner, and over one year most schemes lost money.
Our reading: the holding period, more than the category, decided the result. On this record, equity funds suit money that can stay invested for about ten years; for money needed within a year, FDs did better.
How the holding period changed the result


Read the image as text
Equity funds vs FDs
Reported outcomes to 30 October 2026 · Before tax
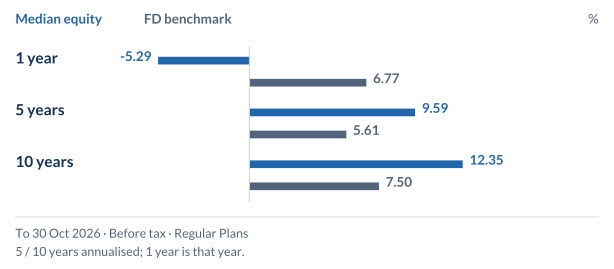
1 year
October 2025 – October 2026
- Median equity fund
- −5.29%
- FD benchmark
- 6.77%
51 of 534 schemes beat the FD benchmark (9.6%).
5 years
October 2021 – October 2026
- Median equity fund
- 9.59%
- FD benchmark
- 5.61%
308 of 334 schemes beat the FD benchmark (92.2%).
10 years
October 2016 – October 2026
- Median equity fund
- 12.35%
- FD benchmark
- 7.50%
233 of 235 schemes beat the FD benchmark (99.1%).
How did we compare funds with FDs?
We took AMFI's published returns for every open-ended equity scheme as on 30 October 2026 and used each category's median scheme: half did better, half worse. Returns are annualised, after expenses, before tax, Regular Plan.
The FD side is generous to FDs: the highest rate on deposits of over one year among major banks, as RBI reports weekly, locked for the full period and compounded quarterly.
Three limits apply. Only schemes that still exist appear, so merged or closed funds drop out. Some ten-year records predate the 2017-18 recategorisation. And this is a lump sum, not a SIP.
Did the median equity fund beat a 10-year FD?
Each row is ₹1 lakh invested on 28 October 2016 and held to 30 October 2026, before tax.
| Category (schemes with a 10-year record) | Median return a year, Regular Plan | Lead over the FD a year | What ₹1 lakh became |
|---|---|---|---|
| FD locked at 7.30%, compounded quarterly | 7.50% | The benchmark itself | ₹2,06,147 |
| Large Cap (24) | 10.81% | 3.31 points | ₹2,79,158 |
| Large & Mid Cap (20) | 12.76% | 5.26 points | ₹3,32,260 |
| Flexi Cap (19) | 11.96% | 4.46 points | ₹3,09,551 |
| Mid Cap (20) | 14.29% | 6.78 points | ₹3,80,121 |
| Small Cap (13) | 15.15% | 7.65 points | ₹4,09,966 |
| ELSS, the tax-saving category (29) | 11.51% | 4.00 points | ₹2,97,159 |
| Sectoral and Thematic (70) | 13.00% | 5.49 points | ₹3,39,372 |
| Aggressive Hybrid, 65–80% in equity (21) | 10.13% | 2.63 points | ₹2,62,537 |
Of all 235 equity schemes with a ten-year record, 233 beat the FD; the two that fell short were sectoral or thematic. Direct Plan medians were about one point a year higher.
Was 2016 a lucky place to start?
We tested three earlier ten-year windows, each against the best major-bank FD rate at the start, locked for ten years. The six categories are Large Cap, Large & Mid Cap, Flexi Cap, Mid Cap, Small Cap and ELSS.
| Ten years to | FD rate at the start | Lowest category median | Its lead over the FD | Schemes in the six categories that beat the FD |
|---|---|---|---|---|
| 31 October 2023 | 9.05% | Large Cap, 13.19% | 3.83 points | 116 of 116 |
| 31 October 2024 | 9.05% | Large Cap, 12.65% | 3.29 points | 122 of 122 |
| 31 October 2025 | 7.90% | Large Cap, 12.63% | 4.49 points | 122 of 122 |
| 30 October 2026 | 7.30% | Large Cap, 10.81% | 3.31 points | 125 of 125 |
The result held each time, including windows that began with FDs at 9%.
Does the same hold over five years, or one?
No. All equity schemes to 30 October 2026, against an FD opened at the start at the best major-bank rate.
| Held for | FD rate at the start | Median equity scheme | Schemes that beat the FD | Schemes that lost money |
|---|---|---|---|---|
| 10 years | 7.30% | 12.35% | 233 of 235 | 0 of 235 |
| 5 years | 5.50% | 9.59% | 308 of 334 | 0 of 334 |
| 1 year | 6.60% | −5.29% | 51 of 534 | 413 of 534 |
Over one year, more than three in four equity schemes were below zero.
How much of the gap survives tax?
Illustration using past returns, not any scheme's expected return: ₹10 lakh for the ten years to 30 October 2026, at a 30% slab, new regime, tax year 2026-27 rules, before surcharge. The FD earns 7.30% compounded quarterly, taxed yearly. The fund earns the Large Cap median of 10.81% and is redeemed once, at the end, with no other equity gains that year.
| ₹10 lakh for 10 years, 30% slab | Value before tax | Value after tax | Return after tax a year |
|---|---|---|---|
| FD at 7.30% | ₹20,61,469 | ₹16,54,133 | 5.16% |
| Fund at the Large Cap median | ₹27,91,581 | ₹25,74,926 | 9.92% |
Tax widened the gap to ₹9,20,792: FD interest is taxed every year at the slab rate, the fund's gain once, at 12.5% plus cess above ₹1.25 lakh. This is general tax information; check your own case with a tax professional. Our mutual funds vs FD tax guide sets out the rules, and the lumpsum calculator runs other rates and periods.
What the median hides
- The ride. The median Large Cap scheme lost 7.40% in the year to 30 October 2026. A ten-year result counts only if you stay invested through such years.
- Your scheme is not the median. Small Cap ten-year returns ranged from 11.24% to 18.90% a year; the weakest sectoral scheme earned 6.08%, below the FD.
- Who this doesn't suit. Money needed within five years, an emergency fund, or anyone who would sell after a 20% fall. FDs carry DICGC insurance of up to ₹5 lakh per depositor per bank; mutual funds have no such cover.
What to check before choosing an equity fund over an FD
- When you need the money: the evidence favoured equity over ten years, was mixed over five, and favoured FDs over one.
- Whether you could hold through a year like the one to October 2026.
- The category's own ten-year record, the expense ratio and the exit load.
- Your tax slab; under the new regime, with total income within ₹12 lakh, FD interest often bears no tax.
Past performance may or may not be sustained in future and is not a guarantee of future returns.
Mutual Fund investments are subject to market risks, read all scheme related documents carefully.